开萌笔记本
主页
归档
关于我
GitHub
找不到相关结果。
亮色
暗色
跟随系统
主页
归档
关于我
GitHub
主题色相
250
横幅设置
首页横幅标题
横幅轮播
水波纹动画
文章布局
列表
网格
开萌笔记本
开萌
记录材料计算、科研绘图与开发配置。
分类
Matplotlib
4
VASP计算
3
Linux
2
Pymatgen
2
VASP
1
站点说明
1
更多
标签
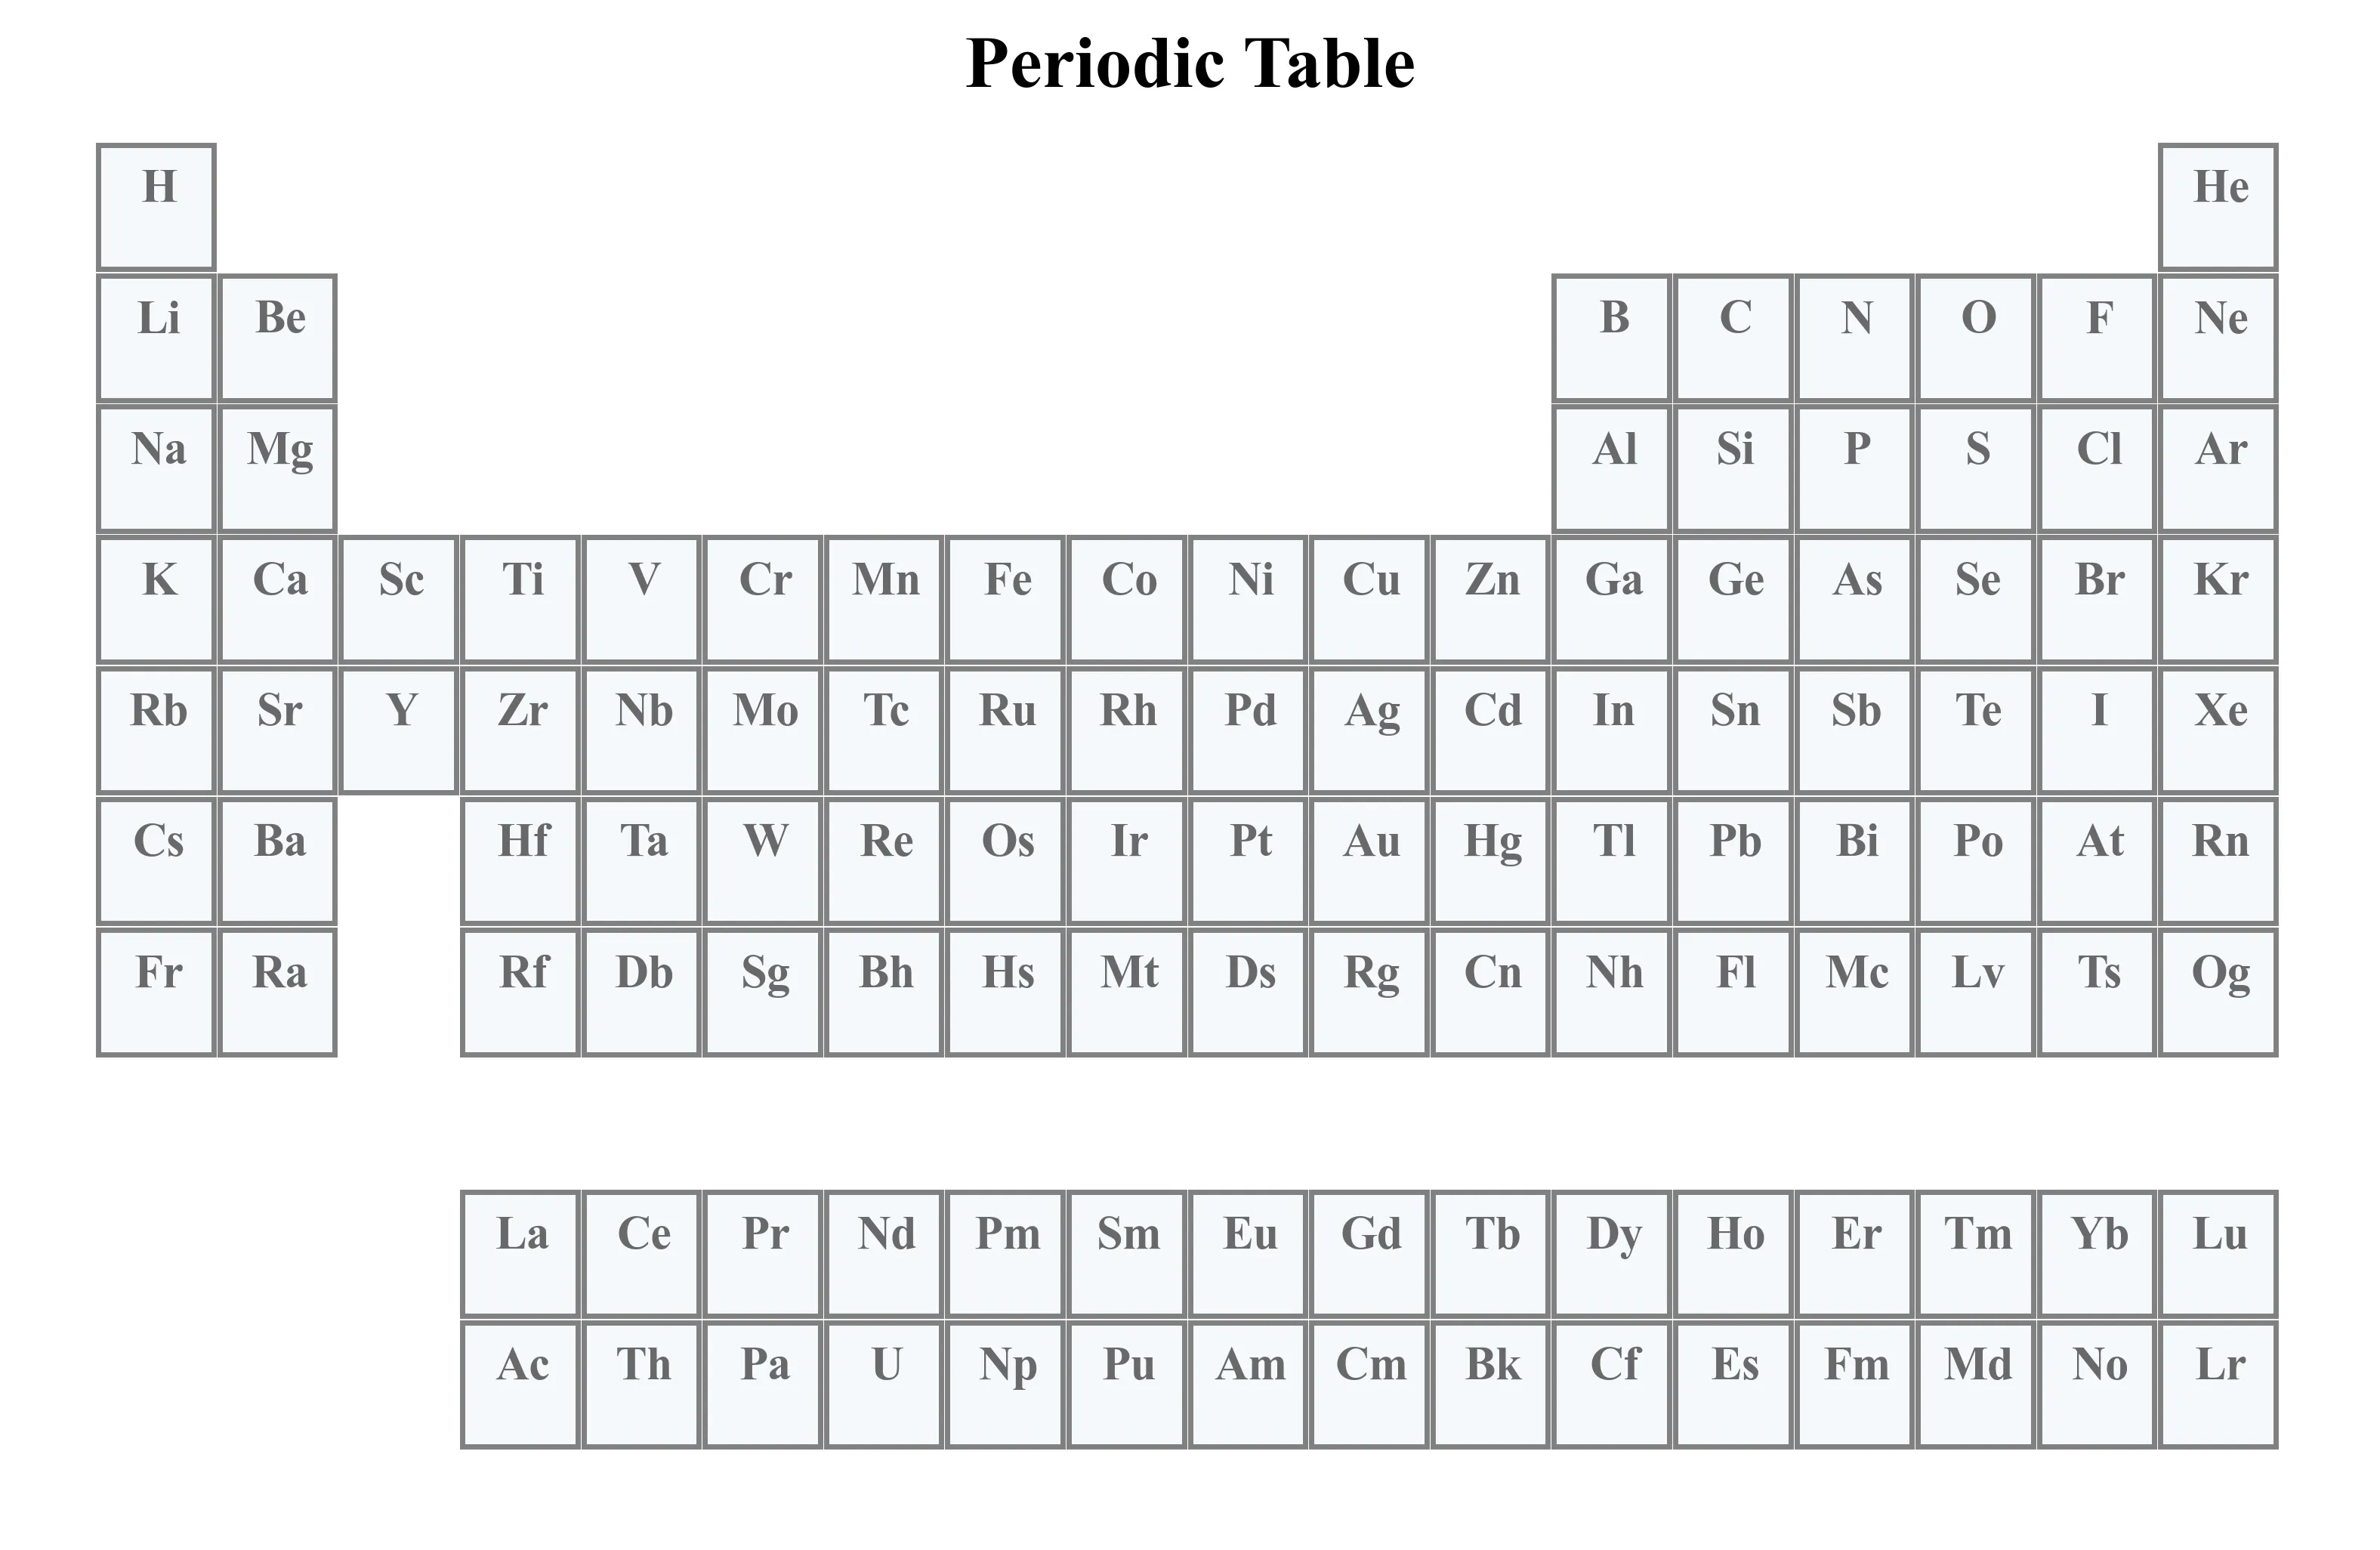
使用Matplotlib画元素周期表
2025-04-25
Matplotlib
使用 Matplotlib 手工绘制元素周期表,并展示如何控制布局、颜色与标注。
#无标签
Image API Error
vasp计算起步
2025-04-24
VASP
面向入门记录 VASP 相关计算的起步笔记。
#无标签
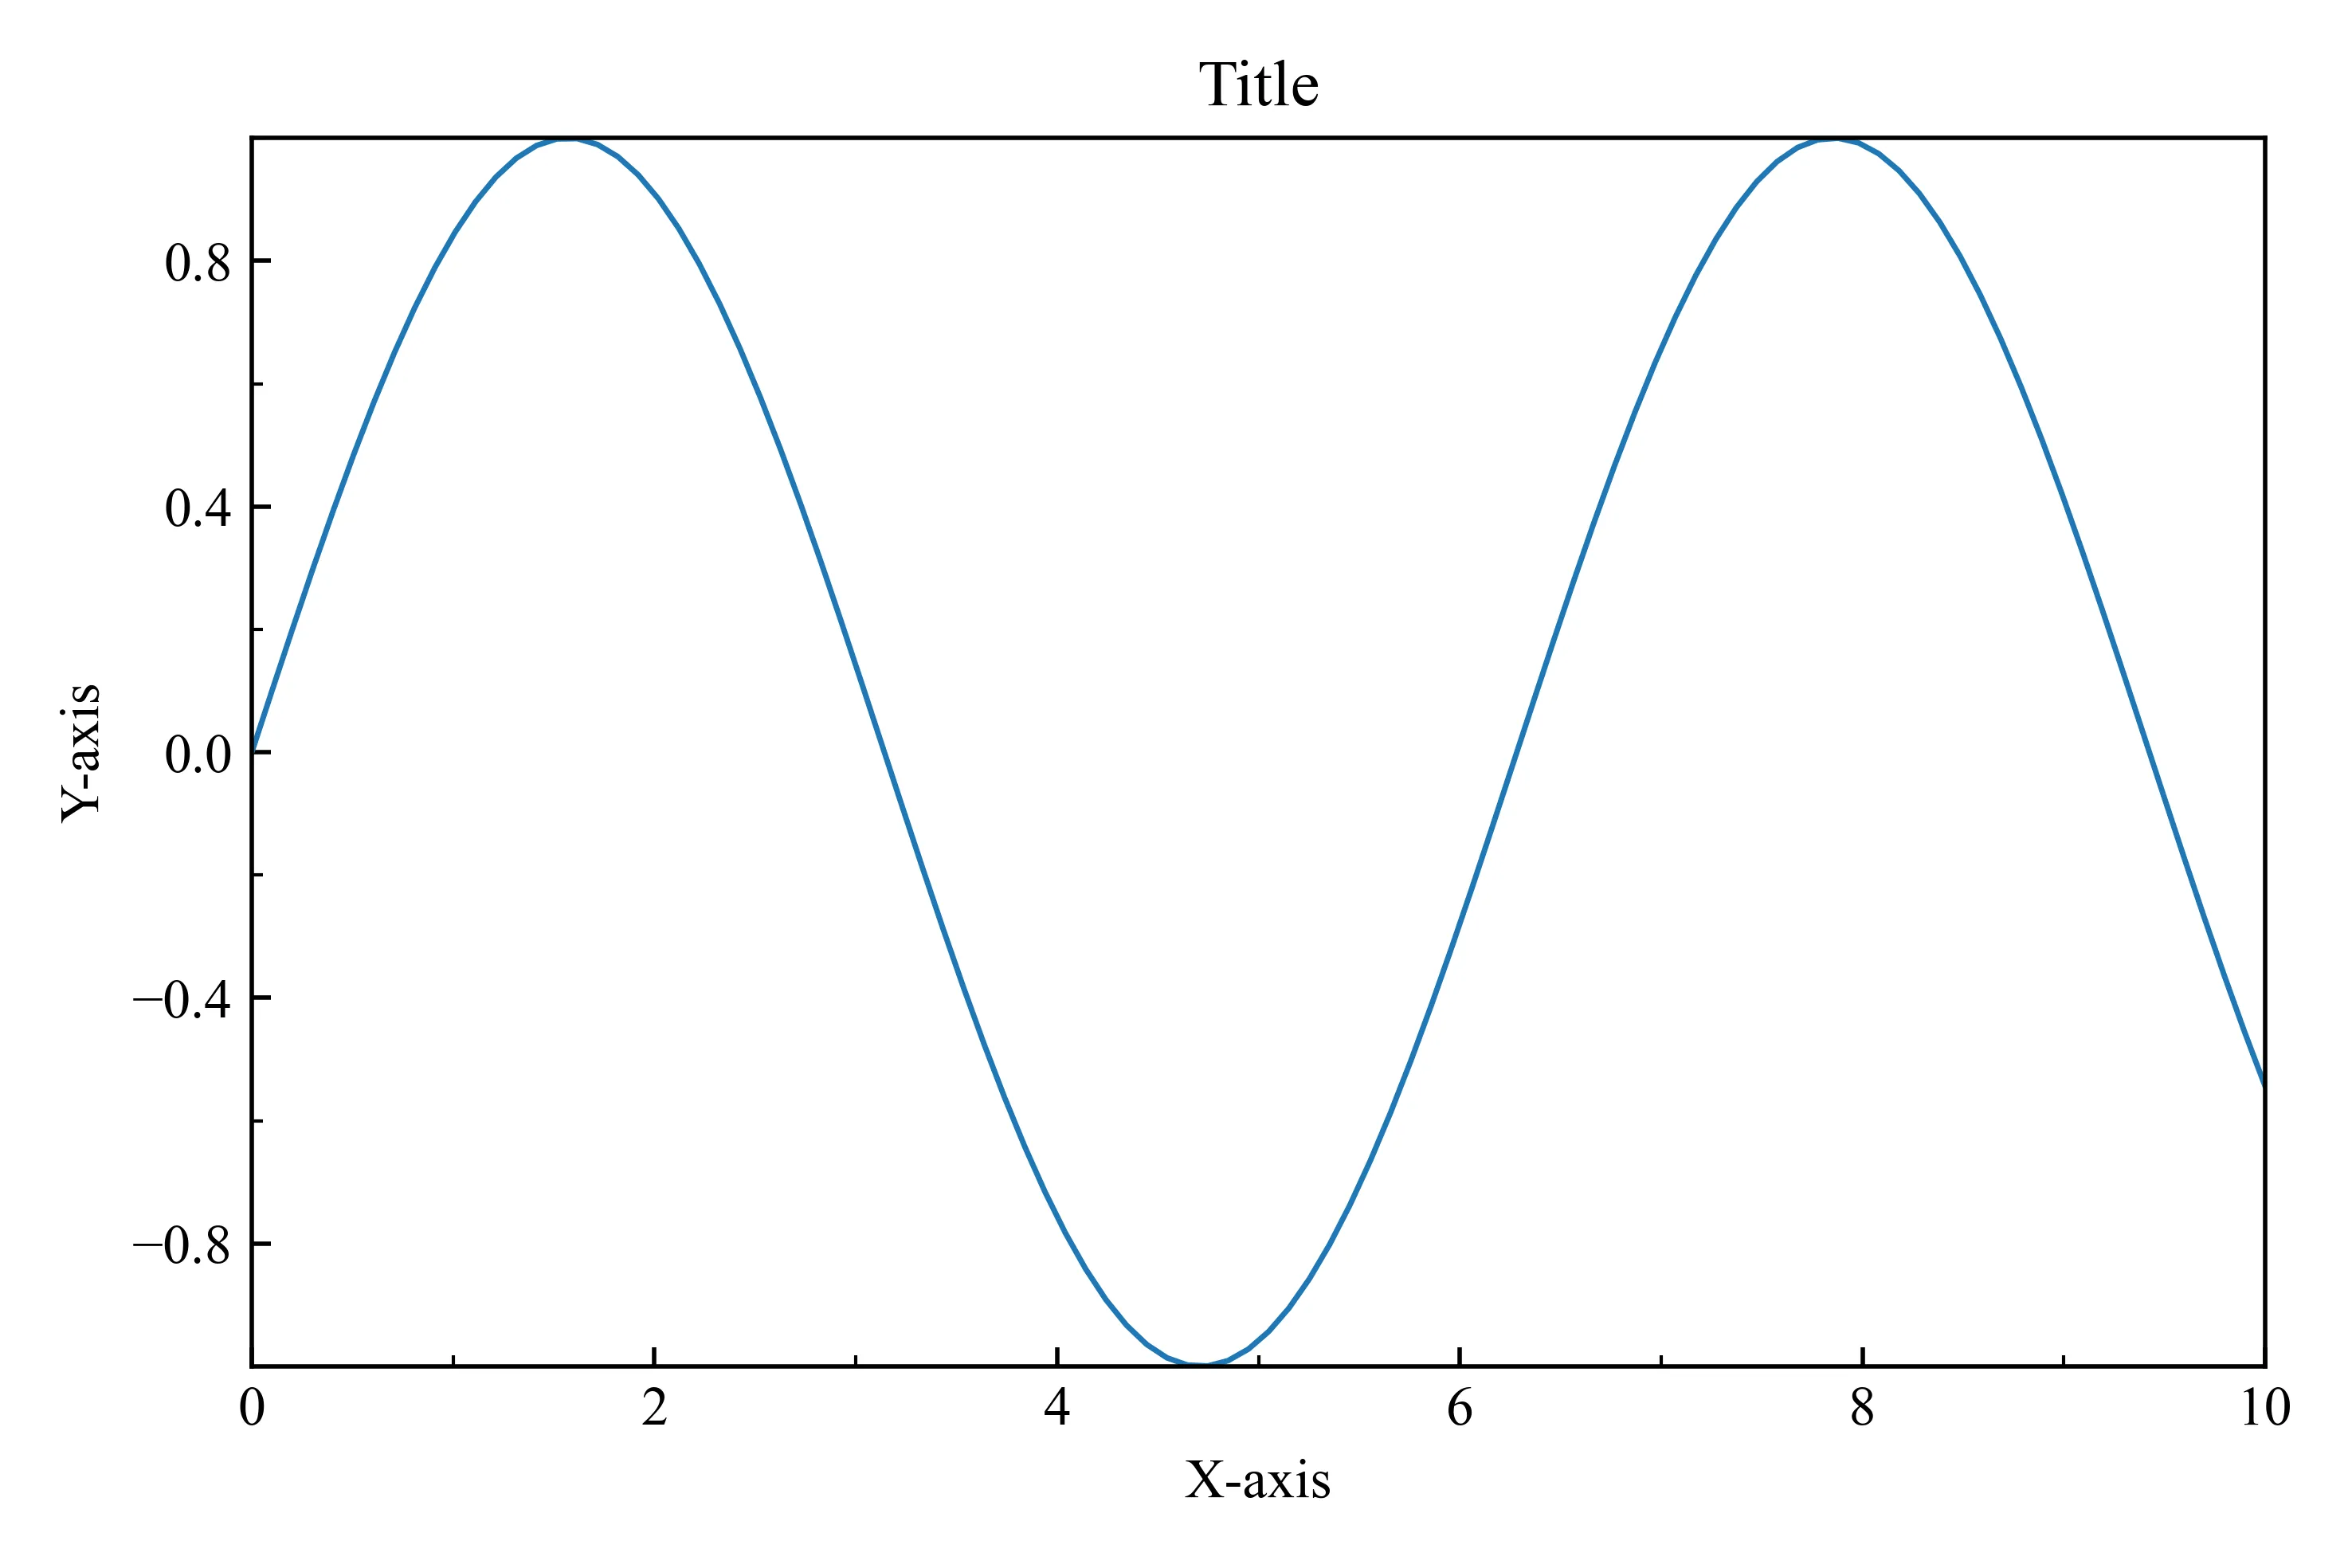
如何使Matplotlib绘图符合科研绘图规范
2025-04-24
Matplotlib
记录如何设置 Matplotlib 的全局参数、图像尺寸与坐标轴,使科研绘图更接近论文风格。
#无标签
Image API Error
1
2
开萌
记录材料计算、科研绘图与开发配置。
分类
Matplotlib
4
VASP计算
3
Linux
2
Pymatgen
2
VASP
1
站点说明
1
更多
标签
目录
 开萌笔记本
开萌笔记本